library(waffle)Loading required package: ggplot2# Create a Vector
x <- c( Awake= 17, Sleep = 7)
# Waffle chart
waffle(x, rows = 4)+
labs(title = "I sleep 7 hours a day on average", subtitle = "Source: self tracking device")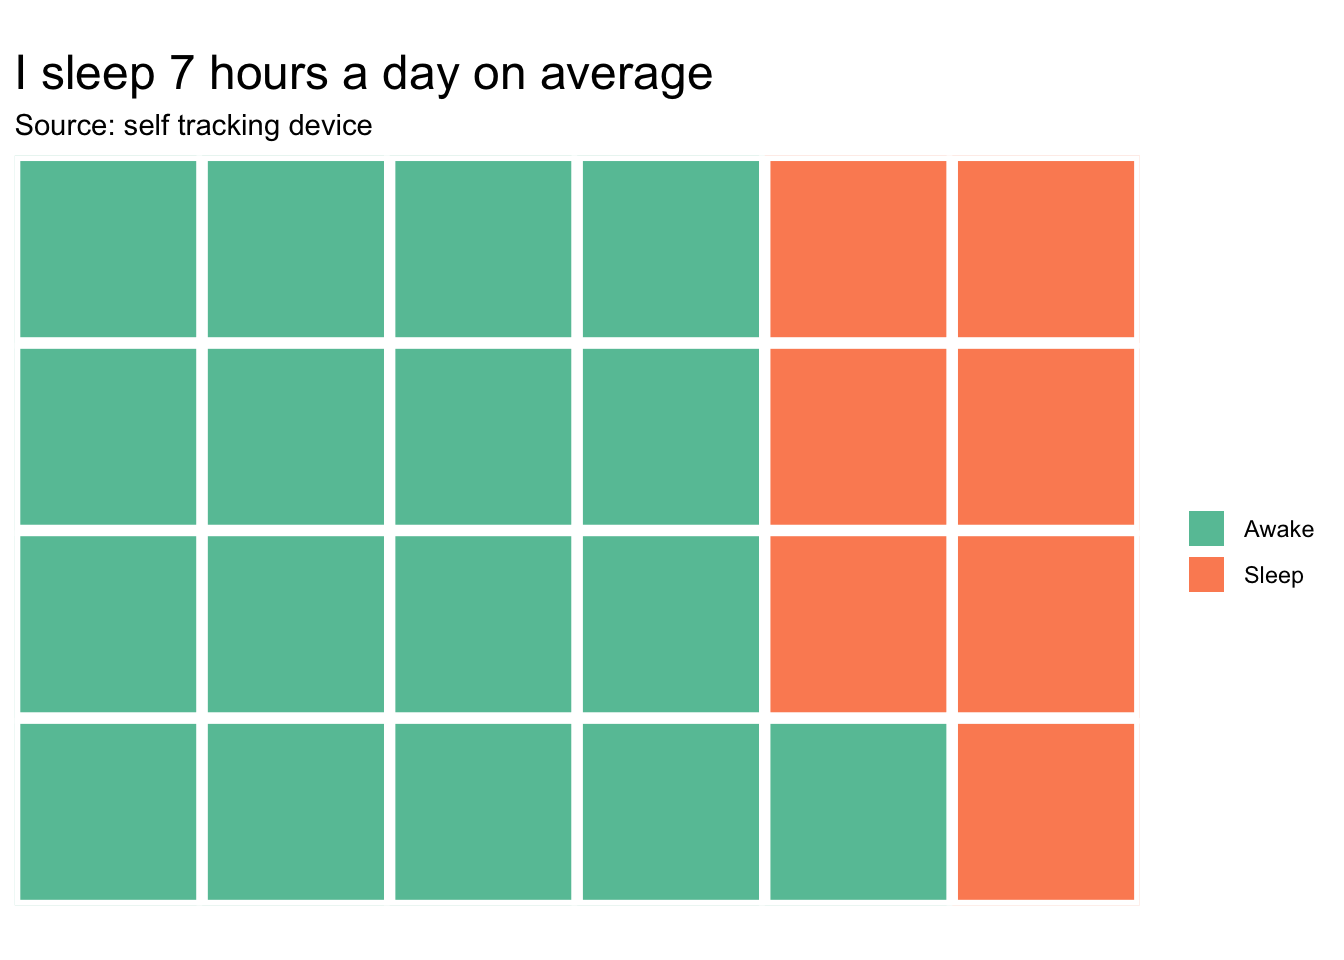
Utilize waffle charts, a grid of small squares or cells, to represent percentages visually. Each cell represents a portion of the whole, making it effective for illustrating part-to-whole relationships.
library(waffle)Loading required package: ggplot2# Create a Vector
x <- c( Awake= 17, Sleep = 7)
# Waffle chart
waffle(x, rows = 4)+
labs(title = "I sleep 7 hours a day on average", subtitle = "Source: self tracking device")