library(highcharter)
library(viridis)
library(tidyverse)
library(crosstalk)
library(plotly)
library(palmerpenguins)
library(reactable)
library(reactablefmtr)
library(dataui)3 fauna-flora
Infuse creativity by using nature-inspired visuals, such as animal or plant shapes, to represent data points.
3.1 Source
3.2 Setup
3.3 A Glimps of Palmer Penguin Dataset
reactable(penguins, style = list(height = "auto", fullWidth = FALSE)) %>%
  add_title(
    title = reactablefmtr::html("Palmer Penguins <img src='https://raw.githubusercontent.com/allisonhorst/palmerpenguins/master/man/figures/lter_penguins.png' alt='Palmer Penguins' width='120' height='60'>"),
    font_size = 16
  ) %>%
  add_subtitle(
    subtitle = 'Palmer Archipelago (Antarctica) penguin data',
    font_size = 14,
    font_color = '#666666',
    margin = reactablefmtr::margin(t=0,r=0,b=0,l=0)
  )
Palmer Penguins 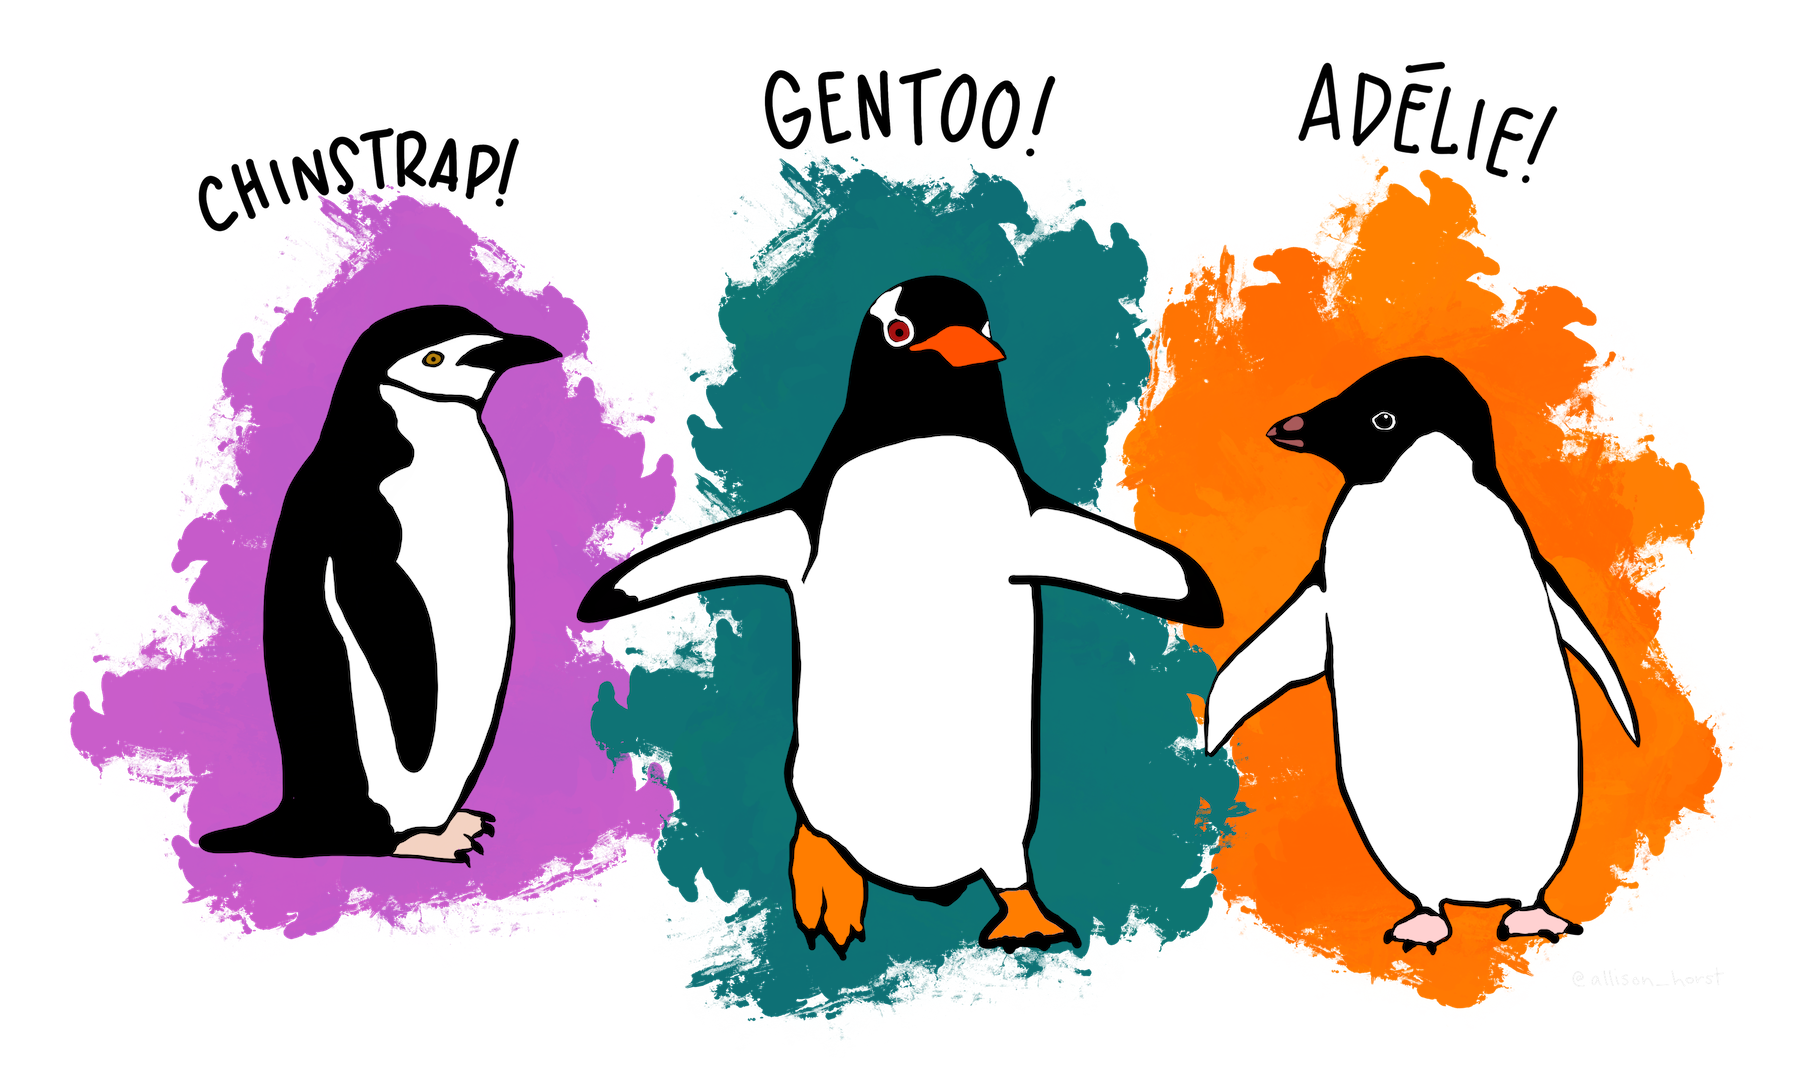
Palmer Archipelago (Antarctica) penguin data
3.4 Visualization
penguins %>%
  group_by(species) %>%
  na.omit(.) %>%
  summarize(across(where(is.numeric), list)) %>%
  mutate(penguin_colors = case_when(
    species == 'Adelie' ~ '#F5A24B',
    species == 'Chinstrap' ~ '#AF52D5',
    species == 'Gentoo' ~ '#4C9B9B',
    TRUE ~ 'grey'
  )) %>%
  select(-c(year,flipper_length_mm,bill_depth_mm, bill_length_mm)) %>%
reactable(
  .,
  theme = default(centered = TRUE),
  compact = TRUE,
  columns = list(
    species = colDef(
      name = 'Species',
      align = 'center',
      maxWidth = 110,
        cell = pill_buttons(
          data = .,
          color_ref = 'penguin_colors',
          text_size = 14,
          brighten_text = FALSE,
          bold_text = TRUE
        )
    ),
    penguin_colors = colDef(show = FALSE),
    body_mass_g = colDef(
      name = 'Body Mass (g)',
      align = 'center',
      maxWidth = 900,
      cell = react_sparkbar(
        data = .,
        fill_color_ref = 'penguin_colors',
        statline = 'median',
        height = 135,
        statline_color = '#252525',
        statline_label_size = '1.1em',
        tooltip_type = 2,
        margin = reactablefmtr::margin(r = 48)
      )
    )
  )
)