Observation Optical density measures how much light a culture scatters. It reflects the total biomass in the tube, but not how that biomass is distributed. Two cultures with the same reading can still contain different numbers of cells
What the reading is made of
The idea is simple, but it changes how we interpret optical density
total biomass ≈ cell concentration × average cell mass optical density sees the left side only
Optical density can rise because there are more cells, because each cell has more mass, or both. The reading cannot distinguish between them. Move the slider to see the same total biomass divided among different numbers of cells
Observation Steady-state growth is a stricter condition than exponential growth. A population is in steady state when the frequency distributions of its cellular properties stop changing over time. Cell number can rise steeply while the population is still nowhere near that condition.
A note on units The original study measured buoyant mass: the mass of a cell minus the mass of the fluid it displaces, read from the frequency shift of a vibrating microfluidic cantilever as each cell passes through. Values are in femtograms, and one femtogram is 10⁻¹⁵ grams. Buoyant mass depends on the density of the surrounding medium, so masses are comparable within a medium but not directly across media.
Watch the cells instead
The graphic shows a fixed volume of culture. The number of cells represents the measured cell concentration, while their area represents the measured mass of individual cells. Together, the total area represents total biomass, the quantity captured by optical density. The capsule shape is only a visual choice. Cell shape was not measured, and the position of each mark has no meaning.
0:15 after inoculation A stationary-phase culture has just been diluted 10,000-fold into fresh medium. The drop contains only about four cells, each weighing around 47 femtograms. At this point, the cells are at their smallest
1:10 The cells are already larger, but their number has barely changed. Before the first division, total biomass has begun to rise because each cell has gained mass
2:08 Median cell mass has passed 230 femtograms, about five times its starting value, while the cell count remains nearly unchanged. The rise in optical density so far is therefore explained by cells gaining mass before division begins
2:40 The mass distribution reaches its widest point here. Cells respond to the fresh medium at different rates, producing the greatest variation observed during the experiment
3:09 The mass distribution narrows and stabilizes as the cell count begins to rise. Mass gain and cell division now proceed at similar rates, marking the start of steady-state growth
4:39 The window is closing as cells begin to divide faster than they gain mass. As a result, the median cell mass falls, even though the optical density still follows a smooth exponential curve
5:10 The window has passed as cells continue to divide and become smaller. The mass distribution shifts back to the left, taking the culture out of steady-state growth even as it continues to get cloudier for hours
Observation Median cell mass began to rise as soon as the culture entered fresh medium. Cell concentration followed about two and a half hours later. This gap shows that the two parts of total biomass change at different times, while optical density combines them into a single reading
Observation Between inoculation and the start of steady-state growth, median cell mass increased from 47 to 492 femtograms. That is a tenfold increase, equal to about 3.4 doublings in mass. Over the same period cell number doubled only onc
The evidence from mass measurements
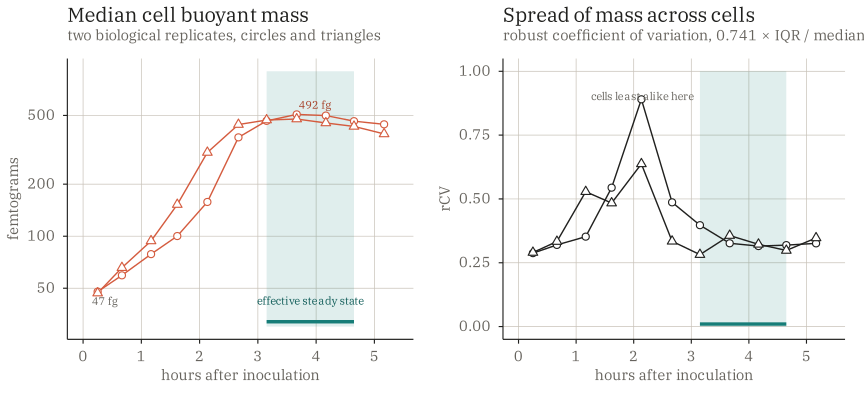
Recomputed from Fig1a1d_SF2a_1G07_1E4_Data_withMetadata.csv. The window shown is the one the original authors drew, 189 to 279 minutes. Both panels tell the same story from different angles: the population is least alike at the moment it is changing fastest, and only settles once mass gain and division balance.
It depends how much you put in first
The same species, medium, and day. Only the amount of stationary-phase culture added to each flask changes. Drag the slider to follow the same moment across all three panels
Observation The 1:10,000 dilution remained in effective steady state for about 90 minutes. The 1:1,000 dilution stayed there for only 30 minutes, while the 1:100 dilution never reached it. Even so, its optical density followed an exponential curve across more than a tenfold increase
Interpretation A culture needs enough room to grow. To reach steady state, its starting cell concentration must be at least one doubling below the concentration where steady state ends. If the culture starts too concentrated, it reaches that limit before it can settle
Observation In the 1:100 cultures of both species, median cell mass begins to fall around the first doubling in cell concentration. Under this condition, cells never settle into a stable balance between gaining mass and dividing
Does this hold across species and media?
Observation The same pattern appears in every condition. Cell mass rises first, followed by cell number. A brief period of steady-state growth then opens and closes while the growth curve still appears exponential
Observation What changes is the size at which cells settle and how long they take to get there. In the defined medium, cells grow faster and become heavier with glucose than with succinate. The mass distributions remain close to log-normal, while those in the two complex media widen before settling
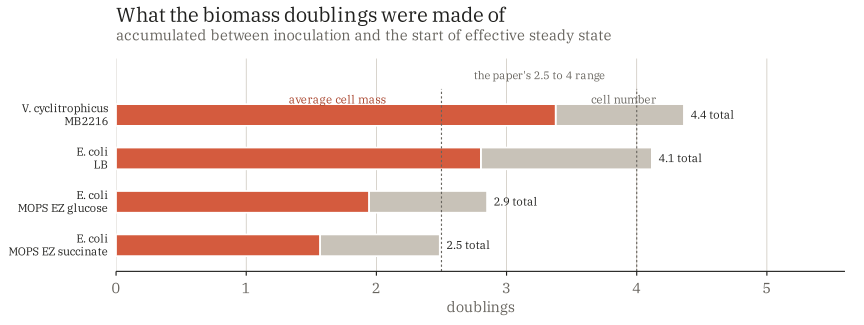
Cell-number doublings are measured from inoculation to the start of the window. Mass doublings are measured from inoculation to the replicate-averaged peak in median mass, following the method used in the original paper. Across all conditions, cell division accounts for roughly one doubling, while the remaining doublings come from cells gaining mass
What to do about it
The original authors propose three simple rules for working with steady-state populations in rich media. These rules set the minimum requirements, but following them does not guarantee steady state
01
Dilute by at least ten thousand fold
Inoculate from an overnight parent culture at 1:10,000 or greater, for organisms with yields around 10⁹ cells per millilitre. Smaller dilutions do not leave enough room for mass gain and division to come into balance before the culture leaves steady state.
Tied to cell yield. An organism with a very different final yield needs a different dilution
02
Allow at least four total-mass doublings
That is a 16fold rise in total biomass before the experiment begins. Measured directly, the tested conditions needed between 2.5 and 4.4, so four is a cautious floor rather than a precise threshold
Fewer doublings than the ten often quoted, but verified only for these strains and media
03
Finish near OD600 0.1, before the first bend
Effective steady state ended near an optical density of 0.1 and a cell concentration of 1–3 × 10⁷ cells per millilitre across all conditions. The growth curve begins to bend soon after, so the bend appears only once the steady-state window has already closed
Optical density readings are device, strain and medium specific. 0.1 on one spectrophotometer is not 0.1 on another
Where this gets tricky Many spectrophotometers become unreliable below an optical density of about 0.01. Starting at 0.01 leaves too little room for four mass doublings before the culture reaches 0.1. You can dilute the culture again during growth, or begin below the instruments range and estimate the starting value from the parent culture and the dilution factor.
Interpretation Most cell divisions in these experiments occurred outside steady state. With a daily 1:100 transfer, cells in a serial-passage evolution experiment would spend almost the entire cycle in this changing state, gaining and losing mass each day
Reading further The full account, including the fixation controls and the cross-sectional validation experiments not retold here, is in the original paper.