My Year (2022) in Music
What a year of Spotify data says about how I actually lived it
Between December 10, 2021 and December 10, 2022 I pressed play 22,197 times. I already wrote about this data once, back in 2022, mostly as a pile of charts. This is a second attempt at the same year. Turns out it was basically a diary. I just didn’t notice while I was living it.
01 · OvertureThe year, in four bars
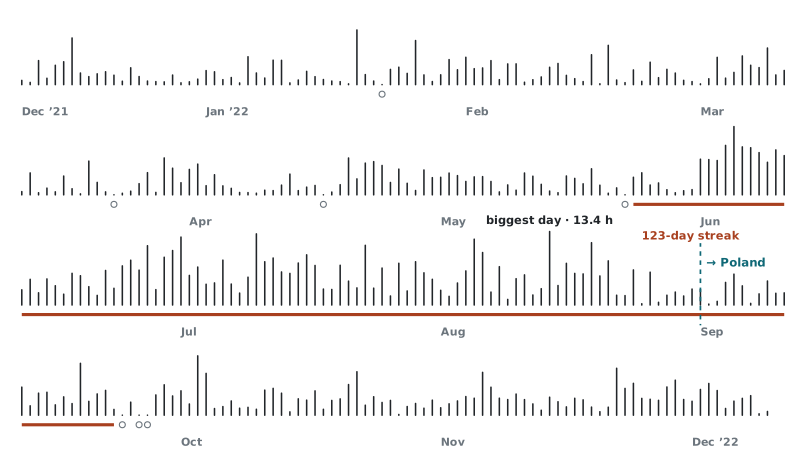
I never thought much about the total while I was listening. But there it is in the shape above: 22,162 music plays across 359 of 366 days, adding up to 1,227.5 hours. Put together, that is about fifty-one full days with music in my ears, listening to 1,068 artists and 2,811 different tracks.
There are not many gaps. I listened to music on 359 of 366 days, usually for about 2.77 hours a day. I also skipped around one in ten plays (9.9%) within thirty seconds. I was probably just looking for the right song. Spotify also recorded 35 podcast plays from 3 shows, adding up to about 16.5 hours. I left those out because I only wanted to look at music here.
At the time I was just listening. But seeing everything together made me curious about what else was hiding in the data. So I started looking, and this page is what I found.
02 · TimelineThe shape of the year
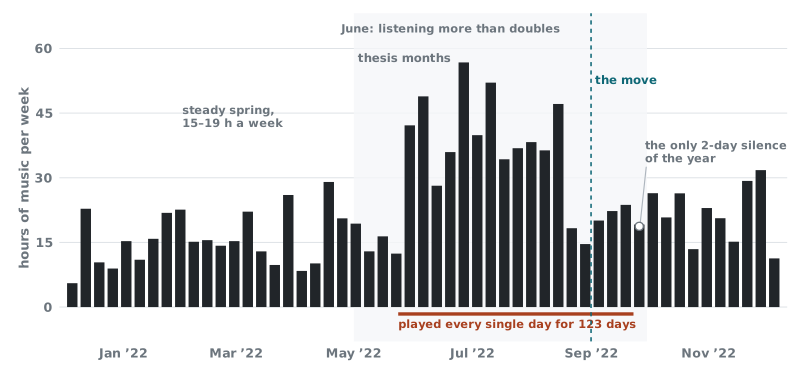
From January to May, my listening barely changed. It stayed between 71.5 and 76.8 hours a month, close to the yearly median. Then it jumped to 185.6 hours in June and 187.7 in July. That was more than two and a half times the spring average of 70.7. I was working on my thesis then and sometimes listened for more than six hours a day. It was less about enjoying the music and more about having something to help me get through the day.
This was also when I had my longest listening streak. From May 24, I played music every day for 123 days. It continued through the thesis, through August with its 146.9 hours of listening, and ended on September 23. Then the pattern changed. Three of the year’s 7 silent days happened within the next four days, on September 24, 26, and 27. This was also around the time I changed timezones. I do not remember exactly what happened on those days. I only know that, after four months of daily listening, the first gaps appeared.
After the move, my listening dropped to around 96.2 to 99.6 hours a month. It was still higher than during spring in Surabaya, but much lower than during the thesis months. Things had calmed down and so had my listening, I GUESS.
03 · Calendar366 days, 7 silences
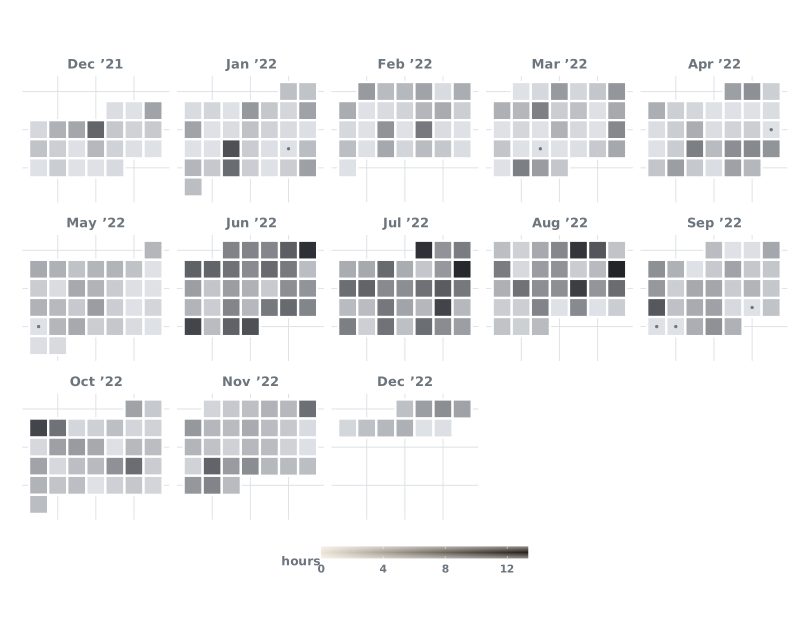
Seven days out of the whole year have zero plays: Jan 22, 2022, Mar 23, 2022, Apr 17, 2022, May 23, 2022, plus the September cluster on the 24th, 26th and 27th. Four scattered silent days over nine months, then three more crammed into four days right at the seam of the year when I moved. Every other day has at least something, anywhere from a few minutes to 13.4 hours on Aug 14, 2022, which I’ll come back to.
04 · The clockWhat time the music happened
First, a correction. The 2022 version of this article shifted every timestamp by minus six hours, which is a timezone in the middle of the Atlantic Ocean, nowhere near anywhere I’ve actually lived. So those charts were wrong, and I wrote interpretations based on them anyway. Spotify exports everything in UTC. This time I converted each play to the clock I was actually on: Surabaya time (UTC+7) until the end of August, then Poland (UTC+2, later +1 once the clocks changed there too). Same raw file, pretty different picture (my bad):
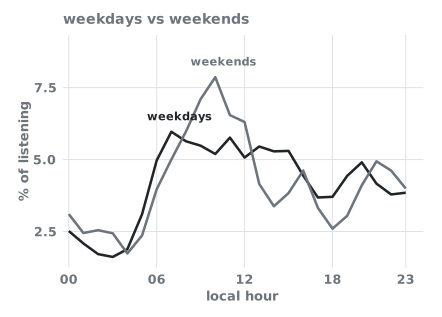
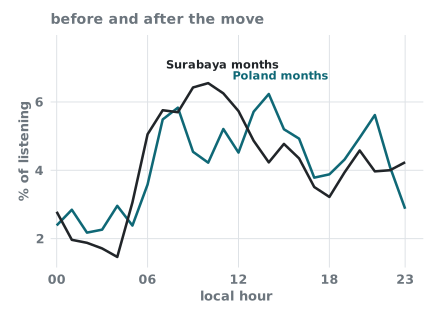
In Surabaya, my listening followed the schedule I had as a student. Most of it started in the morning, peaked between 9 and 11, and slowly decreased through the evening. Only 9.8% happened after midnight. In Poland, I started listening earlier in the morning. There was a peak around 8, another smaller one after lunch between 13 and 14, and more listening late at night. The share after midnight increased to 12.6%. I guess my listening just followed whatever routine I had at the time.
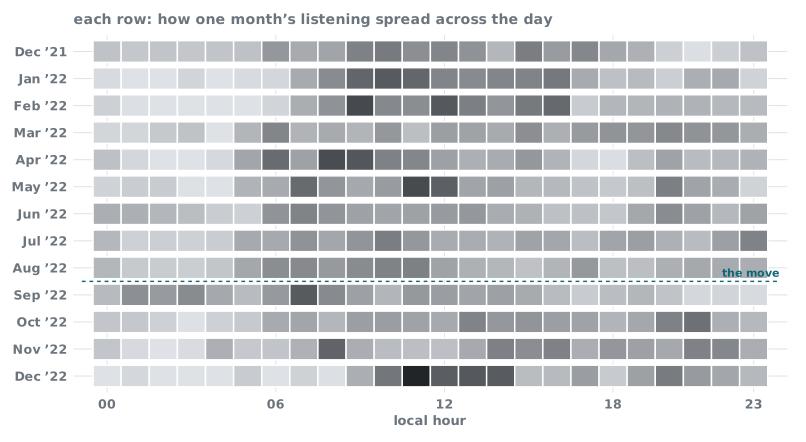
One thing didn’t change at all though is weekends. I averaged 3.35 hours of music on weekdays and 3.36 on weekends, a difference of about a minute. Whatever day of the week it was, I listened about the same amount.
05 · ChaptersArtists as chapters
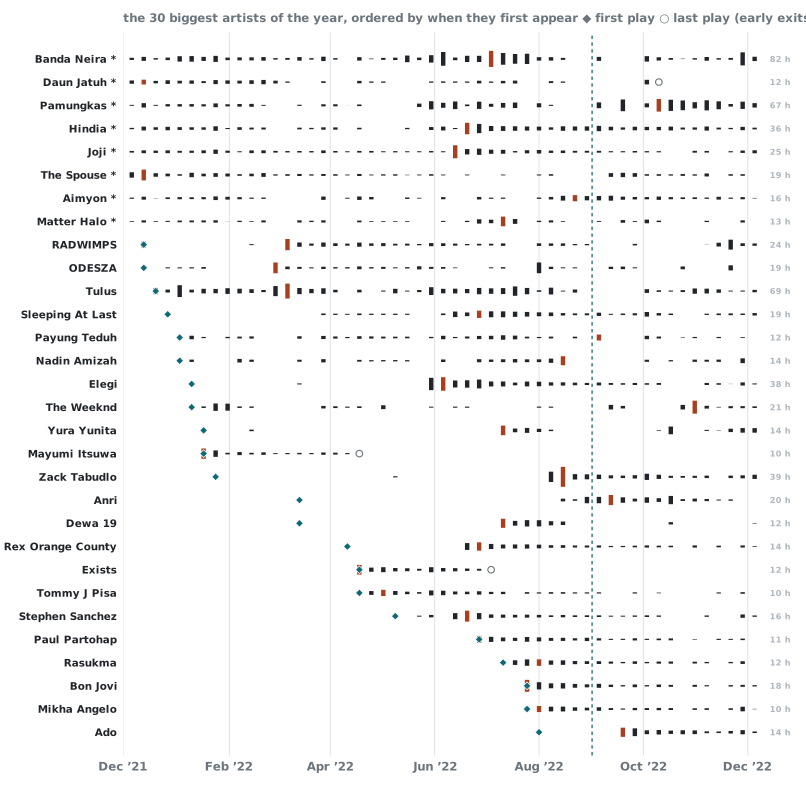
A year is too long for one soundtrack. Mine passed between eleven different artists, one taking over each month across thirteen months. The Spouse had December 2021 (21% of the month, just them). Tulus took January, then took March completely, 30% of an entire month on one artist. Joe Hisaishi got February. Elegi carried me through June’s thesis grind. Banda Neira had July, Zack Tabudlo had August. Then I moved, and the pattern moved with me: Anri (80s Japanese city pop to start the day babyyy) took September, and Pamungkas held both October and November, which felt about right for that period.
swipe sideways to pan →
Follow the debut markers and you can basically see the year happen. Banda Neira leads on total hours (82.1 across 983 plays) without ever owning a single spring month, more of a constant than a phase. Tulus and Pamungkas get more plays (1,322 and 1,335) but fewer hours, shorter songs on tighter repeat. Zack Tabudlo shows up in late January and then explodes in August. Anri debuts three days before I moved, a coincidence I only noticed while writing this. Bon Jovi shows up in late July, 205 plays that are mostly one power ballad. Stephen Sanchez and Joji mark almost exactly the weeks “Until I Found You” and “Glimpse of Us” were everywhere online, so that one’s not really about me (trust me).
06 · GroovesRepetition, variety, and how deep the needle sits
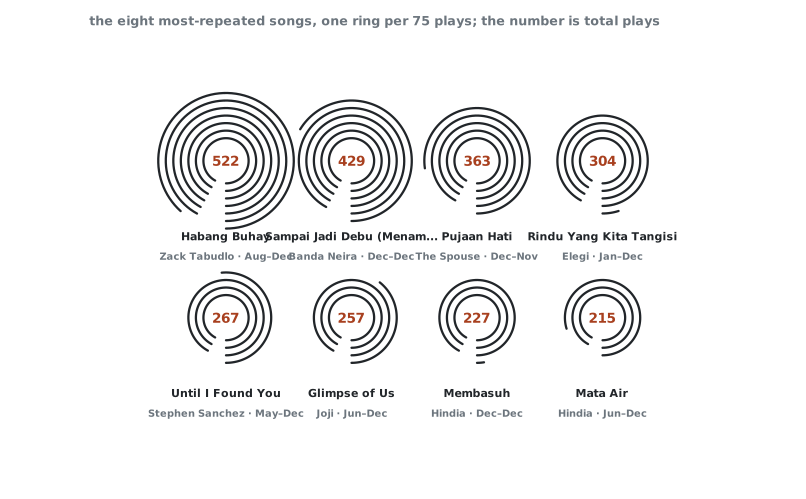
Two songs were far ahead of everything else. “Sampai Jadi Debu” appeared on the first day of the export and was still there on December 8, with 429 plays and 43 hours of listening.
I first heard “Habang Buhay” on Aug 13, 2022, after Chandra introduced it to me during a British American Tobacco international competition in Jakarta. After that, I played it 522 times in 118 days. That is around four and a half plays a day for four months. I kept listening to it after I moved, and it was still showing up when the export ended.
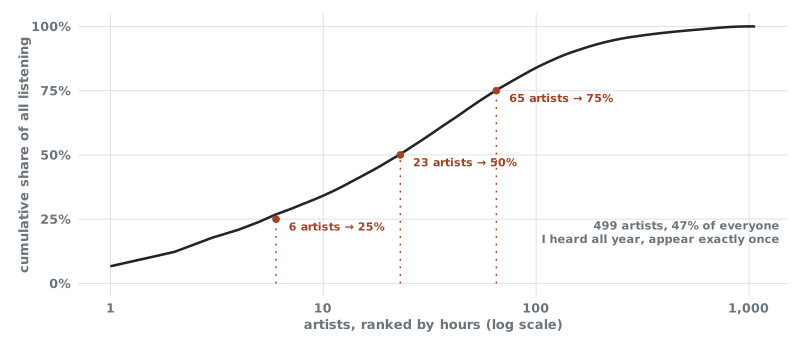
Most of my listening came from a small group of artists. Six artists made up a quarter of everything I played, and 23 made up half. At the same time, I listened to 499 artists only once. That is 47% of all the artists in the data. So there were a few artists I returned to often and many others I tried once and never played again.
The balance between those two groups changed during the year:
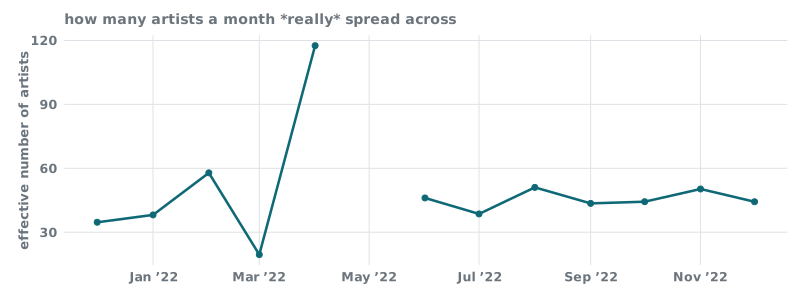
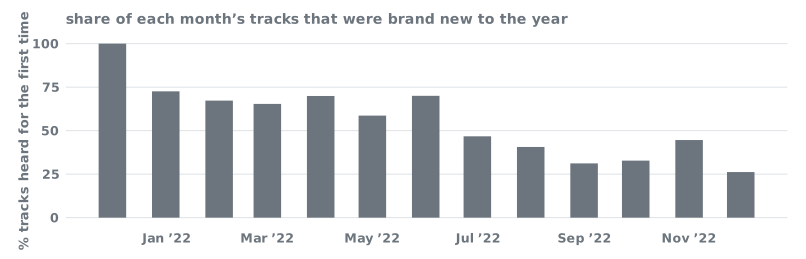
March was mostly Tulus, and the effective number of artists fell to around 19.5. In April, it increased to around 117.6, the highest of the year. I listened to 180 new artists in that month alone. Then came the thesis. In July, I listened to only 33 new artists, the lowest number in any full month. I guess I did not have much attention left to look for new music, so I kept playing what I already knew.
07 · FindingsFive things I didn’t know until I counted
08 · Your turnNow the needle is yours
Everything above is just my read on it. Below is the raw thing, the full play log, filterable by artist and month. Type in any of the 1,068 artists, or tap a chip, narrow it down by month, and you can watch that artist’s year draw itself out: which days, how many hours, what time of day.
09 · MethodHow this was made
The data. One request to Spotify’s account privacy page gets you StreamingHistory*.json. Mine had 22,197 rows, just four fields each: an end timestamp (UTC, minute precision), artist, track, and milliseconds played. No genres, no albums, no location data. Everything on this page comes out of those four columns. 35 podcast plays are excluded from all the music numbers.
Time. I converted timestamps from UTC into whatever timezone I was actually living in: Asia/Jakarta through August 2022, Europe/Warsaw from September onward (the tz database handles daylight saving). The data doesn’t record the exact day I moved, so I set the boundary to September 1. It’s a constant near the top of the pipeline script, easy to change if I ever pin down the real date. The old version of this article used a flat −6 h offset for everything, which was just wrong. That’s the correction in section 04.
Definitions. A play is any row in the export. A skip is anything under 30 seconds. A session is a run of plays with no gap over 30 minutes. A silent day has zero rows. The effective number of artists is the exponential of the Shannon entropy of a month’s hours by artist, basically a fancier way of asking how spread out the listening actually was, not just a headcount.
Honest caveats. The export starts December 10, 2021, so anything marked * in section 05 was already playing before the export begins. Its actual first play is earlier than what’s shown and I can’t recover it. Both Decembers are partial months too. Timestamps only have minute precision, so session boundaries are approximate, not exact. Play counts don’t tell you anything about attention: 522 plays of a song means it was on, not necessarily that I was listening closely. And none of this proves why anything happened. The data gives the what and when. The reasons are just me guessing.
The stack. Data work is in R (tidyverse + jsonlite). Static figures are ggplot2, exported as SVG, set in this site’s own typeface. The calendar, clock lab, and explorer are plain JavaScript reading small JSON files the same pipeline produces, no frameworks, no chart libraries, nothing tracking you. Every number in the text above is computed at render time straight from the pipeline output, so the prose can’t drift out of sync with the data. The full analysis, from raw JSON to every figure, is in the technical notebook, and the pipeline script is in the repo if you want to poke at it.
I rebuilt this in July 2026 from my original Spotify post from 2022. The first version is still here. The typeface is Satoshi. Ember marks repetition, while teal marks something new. All charts were made from my own listening history. Feel free to steal the approach. The notebook shows every step. Built with love and curiosity in R and Quarto by Edo Danilyan.